Source: Atlas of Michigan, ed. Lawrence M. Sommers, 1977.
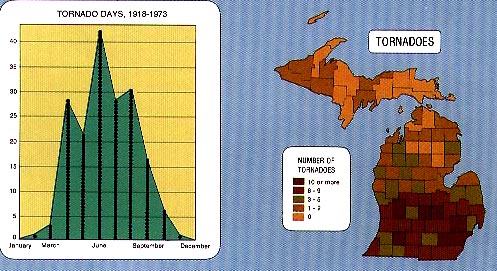
The state of Michigan is no stranger to thunderstorms, severe weather, and tornadoes. The following map indicates the distribution of tornadoes since 1950, per 10,000 square miles. As can be seen, the frequency of tornadoes decreases greatly as one heads north. In addition, tornado frequency generally increases as one moves from west to east. Not surprisingly, the greatest number of tornadoes occur in the Detroit and Flint areas. There appears to be a clear cutoff line from Muskegon to Saginaw to Port Huron, with points to the south much more susceptible to tornadoes than points to the north. This also corresponds with the tension zone across Michigan. The state of Michigan as a whole has experienced 14.1 tornadoes per 1,000 square miles since 1950. Here is how some of the locations in lower Michigan compare with other locations in Tornado Alley.
Cuyahoga, OH (Cleveland) 24.0
Cook County, IL (Chicago) 39.1
Wayne County, MI 42.4
Monroe County, MI 45.4
Genesee County, MI 50.0
St. Louis County, MO 51.1
Dallas County, TX 80.7
The following map and table indicate the locations of strong tornadoes across Michigan. An F4 tornado on the Fujita Scale has winds of (207 - 260 mph). An F5 tornado has winds of (261 - 318 mph). Not surprisingly, all but one of the strong tornadoes have occurred in the 4 southernmost tiers of counties.
Here is a table of the number of tornadoes in each county since 1950, the county's land area, and the number of tornadoes per 1000 square miles since 1950 (Dens, or Density).
| County | Torn | Area | Dens | County | Torn | Area | Dens | County | Torn | Area | Dens |
| Alcona | 8 |
675 |
11.85 |
Gratiot | 8 |
570 |
14.04 |
Missaukee | 7 |
567 |
12.35 |
| Alger | 5 |
918 |
5.45 |
Hillsdale | 18 |
599 |
30.05 |
Monroe | 25 |
551 |
45.37 |
| Allegan | 19 |
828 |
22.95 |
Houghton | 0 |
1012 |
0.00 |
Montcalm | 6 |
708 |
8.47 |
| Alpena | 11 |
574 |
19.16 |
Huron | 8 |
837 |
9.56 |
Montmorency | 5 |
548 |
9.12 |
| Antrim | 7 |
477 |
14.68 |
Ingham | 18 |
559 |
32.20 |
Muskegon | 6 |
509 |
11.79 |
| Arenac | 7 |
367 |
19.07 |
Ionia | 14 |
573 |
24.43 |
Newaygo | 10 |
842 |
11.88 |
| Baraga | 2 |
904 |
2.21 |
Iosco | 9 |
549 |
16.39 |
Oakland | 23 |
873 |
26.35 |
| Barry | 14 |
556 |
25.18 |
Iron | 5 |
1167 |
4.28 |
Oceana | 5 |
541 |
9.24 |
| Bay | 11 |
444 |
24.77 |
Isabella | 10 |
574 |
17.42 |
Ogemaw | 9 |
564 |
15.96 |
| Benzie | 4 |
321 |
12.46 |
Jackson | 13 |
707 |
18.39 |
Ontonagon | 2 |
1312 |
1.52 |
| Berrien | 25 |
571 |
43.78 |
Kalamazoo | 19 |
562 |
33.81 |
Osceola | 9 |
566 |
15.90 |
| Branch | 14 |
507 |
27.61 |
Kalkaska | 5 |
561 |
8.91 |
Oscoda | 4 |
565 |
7.08 |
| Calhoun | 11 |
709 |
15.51 |
Kent | 18 |
856 |
21.03 |
Otsego | 2 |
515 |
3.88 |
| Cass | 10 |
492 |
20.33 |
Keweenaw | 1 |
541 |
1.85 |
Ottawa | 15 |
566 |
26.50 |
| Charlevoix | 2 |
417 |
4.80 |
Lake | 1 |
568 |
1.76 |
Presque Isle | 5 |
660 |
7.58 |
| Cheboygan | 3 |
716 |
4.19 |
Lapeer | 12 |
654 |
18.35 |
Roscommon | 7 |
521 |
13.44 |
| Chippewa | 6 |
1561 |
3.84 |
Leelanau | 2 |
349 |
5.73 |
Saginaw | 14 |
809 |
17.31 |
| Clare | 6 |
567 |
10.58 |
Lenawee | 25 |
751 |
33.29 |
Sanilac | 11 |
964 |
11.41 |
| Clinton | 14 |
572 |
24.48 |
Livingston | 16 |
568 |
28.17 |
Schoolcraft | 2 |
1178 |
1.70 |
| Crawford | 8 |
558 |
14.34 |
Luce | 2 |
903 |
2.21 |
Shiawassee | 17 |
539 |
31.54 |
| Delta | 8 |
1170 |
6.84 |
Mackinac | 4 |
1022 |
3.91 |
St. Clair | 12 |
725 |
16.55 |
| Dickinson | 3 |
766 |
3.92 |
Macomb | 17 |
480 |
35.42 |
St. Joseph | 6 |
504 |
11.90 |
| Eaton | 16 |
577 |
27.73 |
Manistee | 1 |
544 |
1.84 |
Tuscola | 10 |
813 |
12.30 |
| Emmet | 5 |
468 |
10.68 |
Marquette | 6 |
1821 |
3.29 |
Van Buren | 13 |
611 |
21.28 |
| Genesee | 32 |
640 |
50.00 |
Mason | 4 |
495 |
8.08 |
Washtenaw | 21 |
710 |
29.58 |
| Gladwin | 8 |
507 |
15.78 |
Mecosta | 8 |
556 |
14.39 |
Wayne | 26 |
614 |
42.35 |
| Gogebic | 2 |
1102 |
1.81 |
Menominee | 5 |
1044 |
4.79 |
Wexford | 6 |
566 |
10.60 |
| Gd. Traverse | 3 |
465 |
6.45 |
Midland | 8 |
521 |
15.36 |
Strong Tornadoes (F4 or F5) 1950-2000
| County | Date | Time | Mag | Deaths | Injuries |
| St. Clair | 05/21/53 | 1521 | F4 | 2 | 68 |
| Monroe | 06/08/53 | 1715 | F4 | 4 | 18 |
| Genesee | 06/08/53 | 1930 | F5 | 116 | 844 |
| Lapeer | 06/08/53 | 2130 | F4 | 0 | 23 |
| Manistee | 04/03/56 | 1735 | F4 | 2 | 24 |
| Allegan | 04/03/56 | 1745 | F5 | 18 | 340 |
| Genesee | 05/12/56 | 1725 | F4 | 3 | 116 |
| Wayne | 05/12/56 | 1755 | F4 | 0 | 22 |
| Livingston | 07/04/57 | 1755 | F4 | 0 | 6 |
| Macomb | 05/08/64 | 1559 | F4 | 11 | 224 |
| Ottawa | 04/11/65 | 1654 | F4 | 5 | 142 |
| Branch | 04/11/65 | 1803 | F4 | 23 | 294 |
| Branch | 04/11/65 | 1840 | F4 | 21 | 293 |
| Clinton | 04/11/65 | 1915 | F4 | 1 | 8 |
| Monroe | 04/11/65 | 2035 | F4 | 2 | 29 |
| Clinton | 04/21/67 | 1915 | F4 | 0 | 8 |
| Oakland | 03/20/76 | 1815 | F4 | 1 | 55 |
| Kalamazoo | 04/02/77 | 1332 | F4 | 0 | 10 |
| Eaton | 04/02/77 | 1406 | F4 | 1 | 44 |
The following tables display the deadliest thunderstorm events since 1950 and the costliest weather events from 1993-2000. Deadliest Thunderstorm Events 1950-2000
| Location | Date | Type | Deaths |
| Southeast Lower | 06/08/53 | Tornadoes | 125 |
| Southern Lower | 04/11/65 | Tornadoes | 53 |
| Allegan/Manistee | 04/03/56 | Tornadoes | 20 |
| Macomb County | 05/08/64 | Tornado | 11 |
| Southeast Lower | 07/02/97 | Tornadoes/Winds | 7 |
| Kalamazoo County | 05/13/80 | Tornado | 5 |
Costliest Weather Events 1993-2000
| Location | Date | Event | Damage ($Millions) |
| Statewide | 05/31/98 | Thunderstorms | 172.0 |
| Statewide | 07/02/97 | Tornado Outbreak | 143.5 |
| Statewide | 07/13/95 | Thunderstorms | 54.1 |
| Statewide | 01/13/94 | Record Cold | 50.0 |
| Metro Detroit | 07/21/98 | Thunderstorms | 40.9 |
| Thumb, Saginaw Valley | 06/21/96 | Thunderstorms | 25.8 |
| Wayne County | 09/11/00 | Flooding | 20.0 |
| Southeast Lower | 03/13/97 | Ice Storm | 19.0 |
| Northern Lower | 09/26/98 | Thunderstorms | 12.3 |
| Mid-Michigan | 04/19/93 | Flooding | 10.0 |
Source: Atlas of Michigan, ed. Lawrence M. Sommers, 1977.
Sources
National Weather Service – Detroit/Pontiac, Michigan project..crh.noaa.gov/dtx/start.htm
National Climactic Data Center project..ncdc.noaa.gov
Midwestern Climate Center http://mcc.sws.uiuc.edu
This page was created by Andrew Huizinga, a GEO 333 student.
This material has been compiled for educational use only, and may not be reproduced without permission. One copy may be printed for personal use. Please contact Randall Schaetzl (soils@msu.edu) for more information or permissions.