Air temperatures generally decrease across the Great Lakes region from north to south. However, the influence of the Great Lakes on this general N-S pattern is quite strong and very apparent.
The annual mean temperature within the state ranges from a maximum of about 50� F in the southern Lower Peninsula to a minimum of almost 40� F in the Upper Peninsula. The lower average temperatures in northern Michigan result generally from the fact that this area receives more frequent polar air masses and a lower amount of solar energy. Lying nearer the source region for the cold-air masses than the southern Lower Peninsula, these northern areas are under the influence of polar air a greater number of days during all seasons.
During the summer, the south-to-north decline in mean temperature is less evident. In the Lower Peninsula, temperatures are highest in the extreme southern counties, away from the moderating effects of Lake Michigan, and in the Upper Peninsula the highest are in the western counties. The southern Lower Peninsula is warmest because it lies comparatively near the source of warm air (which in the summer covers much of the southern Great Plains and Gulf coastal states) and farther from the polar-air source in northern Canada.
Average July temperatures are lowest in the eastern Upper Peninsula and the Keweenaw Peninsula, in part because these regions lie immediately downwind of Lake Superior and often experience the chilled air that moves off the water. But the lowering of the maximum temperatures by Lakes Superior and Michigan cannot entirely explain the pattern of lower summertime mean temperatures in the eastern Upper Peninsula. Further explanation lies in the normal evolution of daily weather patterns. Weather disturbances (cold fronts and cyclonic storms) cross the northern Great Lakes regularly during most summers and are preceded by a period of southwesterly surface winds lasting a day or longer. Air drawn northeastward in this flow originates over Iowa, Minnesota, the Dakotas, Nebraska, or from areas even more distant where, because of normal summer patterns, temperatures are higher. Since the warm air comes from the southwest before it is interrupted by a new southeastward-moving cold front, the western counties of the Upper Peninsula warm faster and have higher temperature extremes. For example, the absolute maximum temperatures at Watersmeet in eastern Gogebic County and Iron Mountain have been 100� F and 102� F, respectively, but the absolute maximum temperatures of Sault Ste. Marie have been only 98� F in August and 94� F in July.
The pattern of average daily maximum temperatures in July clearly indicates the great frequency of warm air masses in the southern Lower Peninsula and, to a lesser extent, the western Upper Peninsula. Air is capable of pushing afternoon temperatures above 90� F in the southern Lower Peninsula normally resides over the western and southern Great Plains and a good part of the states bordering on the Gulf of Mexico. Time is required to transport this air into Michigan, and the farther north and east it is to move, the longer a weather pattern that is favorable to a surface southwesterly flow must hold. Because weather disturbances sweep eastward across the northern Midwest every two to four days, there is seldom enough time between systems for the warmer air to reach into northern Michigan before it is displaced by a new cool-air mass from the northwest. The southern Lower Peninsula, lying closer to the warm air source, is more frequently affected by this air and also experiences weather changes less often, which means the southwesterly flow has more time to transport warm air into the region. Hence, the processes responsible for the higher average summer temperatures in both the southern Lower Peninsula and the western Upper Peninsula are similar.
Snow cover also contributes to lower winter temperatures in the north. Once established, snow promotes faster nighttime reradiation and colder overnight minimum temperatures than there would be otherwise, so the average daily minimum temperatures are lower. Since daytime heating must then start from lower minima and a greater percentage of incoming solar radiation is reflected from snow than from a darker, snow-free landscape, snow cover helps create lower maximum temperatures as well.
The weather patterns that maintain the lower mean winter temperatures in the north are similar to those that keep the northern areas cooler in the summer. Lying nearer the cold-air source areas, the Upper and northern Lower Peninsulas are affected by polar air more often than the southern Lower Peninsula is. In addition, brief intrusions of milder southewesterly air produce occasional thaws in the southern Lower Peninsula; these normally prevent the snow cover from lingering continuously all winter. Without a deep snow cover, a quicker temperature recovery is possible during the intervals of a milder southwesterly flow, and nighttime minimum temperatures will be less extreme. In contrast, the combined effects of more polar air masses and deeper, more persistent snow cover-itself partly a result of a higher frequency of polar air-produce lower mean and extreme temperatures in the Upper and northern Lower Peninsulas during the winter.
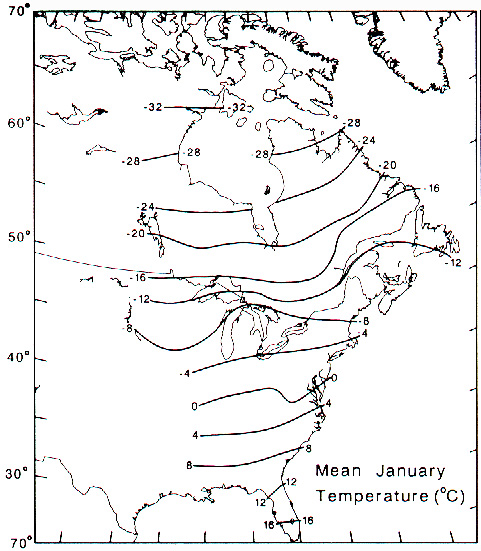
The regional map of January air temperatures shown below illustrates the point that many
sites in Michigan, near the comparatively warm Great Lakes, are as warm as sites further
south but away from the lakes. This is because the lakes warm the coldest air that
passes over them, making for warmer temperatures in the coldest part of the winter.
Source: Unknown
On a more detailed level of analysis (below), it can be seen quite clearly that sites
nearer the Great Lakes are much warmer in January than are sites inland.
Source: Unknown
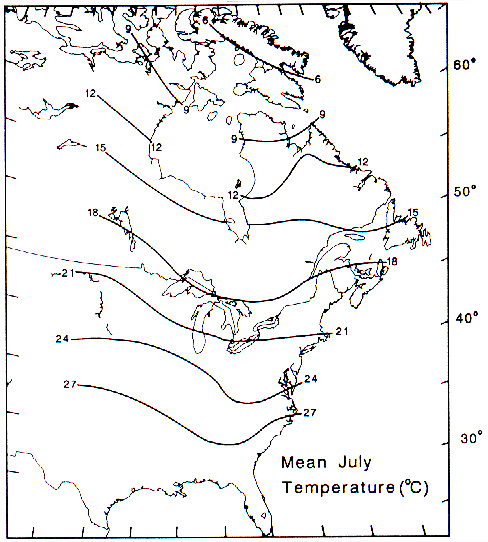
In summer, air temperature are closer to those of the Great Lakes, and hence the "lake effect" on air temperature is less pronounced. The N-S gradient in July temperatures, shown below, is more latitudinal and is less "broken up" by the lakes.
Source: Unknown
Source: Unknown
Of course, mean temperatures are only part of the story. What are also important are
maximum and minimum temperatures. The map below shows the former, for July.
Note how much the lakes affect maximum summertime temperatures!
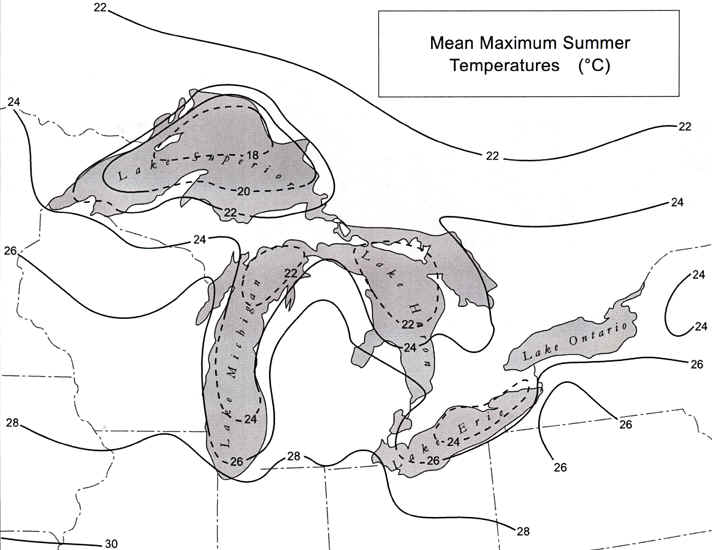
Source: Michigan State University, Department
of Geography
Similarly, we can examine average minimum temperatures in the winter. Now note how much
warmer the lakes keep the areas nearby, when compared to inland sites.
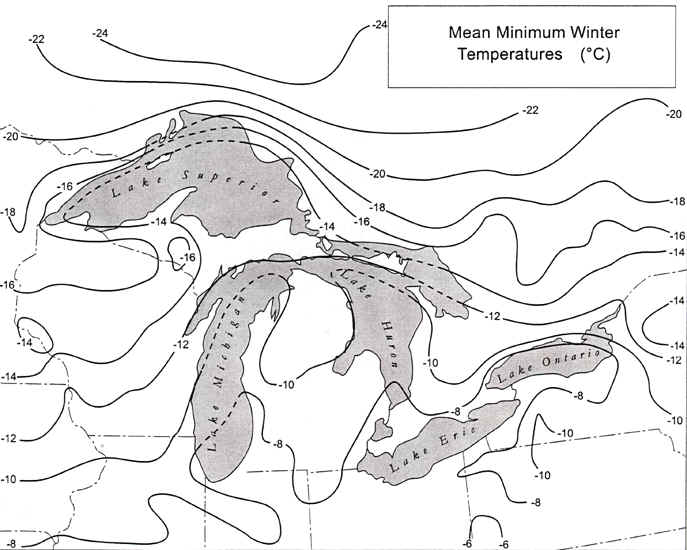
Source:
Michigan State University, Department of Geography
The "Lake effect" takes on many other aspects. First, it delays the onset of
warm temperatures in spring, because the lake, which is slow to warm up in spring,
keeps the air near the lake cool. The map below, which shows the date of last
expected spring freeze, illustrates an important corollary to point #1: the last frost
in spring is earlier along the lake than at inland sites of similar latitude.
Thus, the likelihood of a late spring frost is minimized.
Second, the first frost in fall is often delayed.
Cold air, invading from Canada, has to cross the (now warmer) Lake Michigan. Cold air
masses are warmed significantly as they cross the lake, and clouds formed by the exchange
of heat and moisture from the lake moderate the temperature of downwind locations even
further, significantly delaying the onset of cold weather in the late fall (relative to
sites upwind of the lakes, or farther inland). The lakeshore area is a delightful place in
fall!
Third, the lake makes the hottest summer days a bit cooler.
Extremely high temperatures are not common near the lake, where the cool waters and
associated lake breezes keep the air cool.
Fourth, absolute minimum temperatures in winter are not as low
as inland. These very coldest periods of the winter are, again, moderated by the
lake, which rarely freezes and thus, still has the ability to moderate the air at it
crosses the open water. The maps below show the number of years (out of 30) that one
could normally expect each winter, with cold (< -10F) or very cold (< -15F) days.
Note that, near the lake, the number of years with such "very cold" days
is less than farther inland. The lack of (or at least, limited incidence of)
extremely cold days is a positive for fruit growers, since these
very cold temperatures (found more often in inland locations) could damage the buds on
fruit trees.
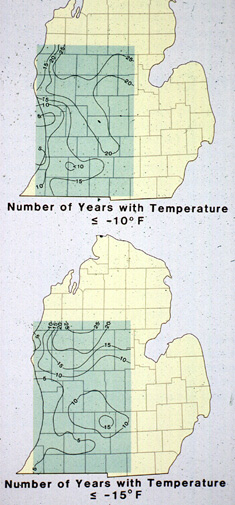
Source: Unknown
Lake effect lengthens the growing season--defined as the number of days
between the last spring frost and first frost in fall. The reasons why the last
spring frost comes so early and the first frost in fall arrives so late are given
above...and a map of the length of the growing season in Michigan is given below.
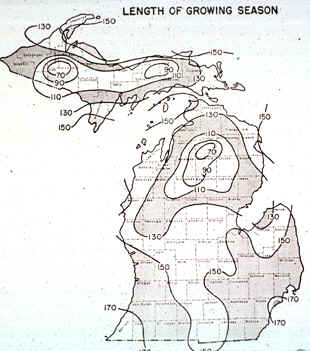
Source: Unknown
One popular and instructive way of viewing climate patterns is with climagraphs.
A climagraph shows mean monthly air temperatures and precipitation totals. The map
below shows some of the typical climagraphs for the Great Lakes region.
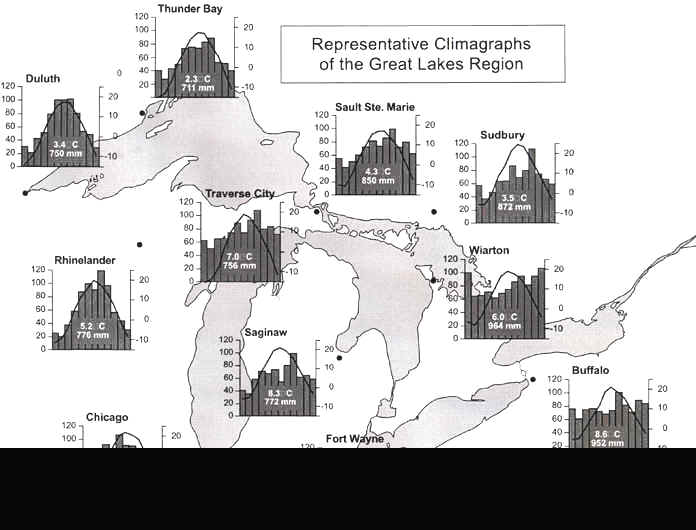
Source: Michigan State University, Department of Geography
The most obvious temperature trend from the climagraphs above is that August is the
warmest month almost everywhere, while January is the coldest month.
Parts of the text on this page have been modified from L.M. Sommers' book entitled, "Michigan: A Geography".
This material has been compiled for educational use only, and may not be reproduced without permission. One copy may be printed for personal use. Please contact Randall Schaetzl (soils@msu.edu) for more information or permissions.