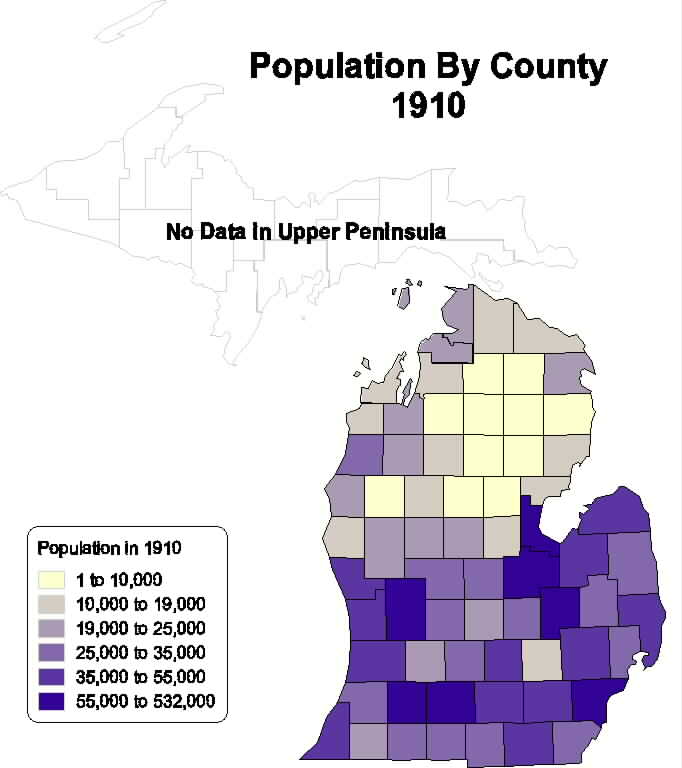
POPULATION GROWTH IN MICHIGAN
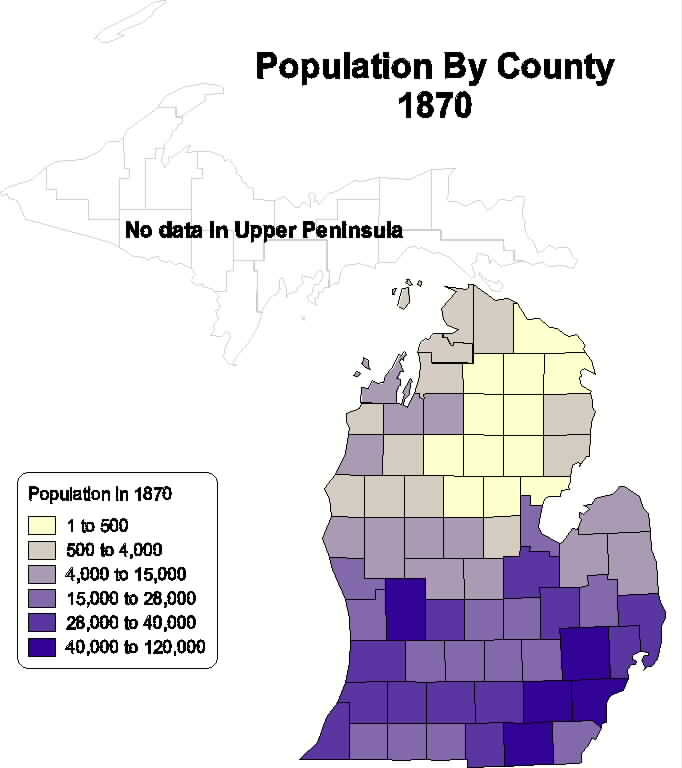
The series of maps below show the distribution of Michigan's residents during the late
19th and early 20th centuries. For the most part, data for the UP is lacking.
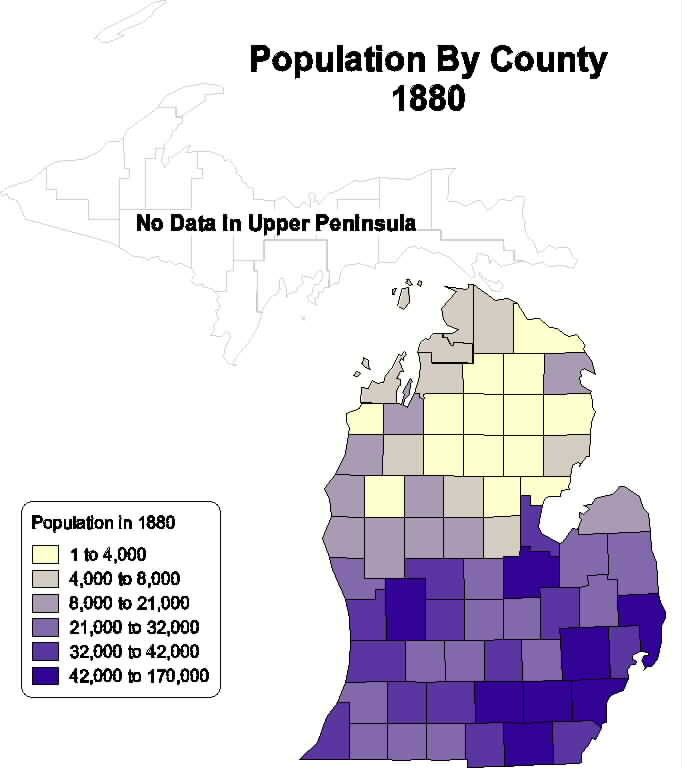
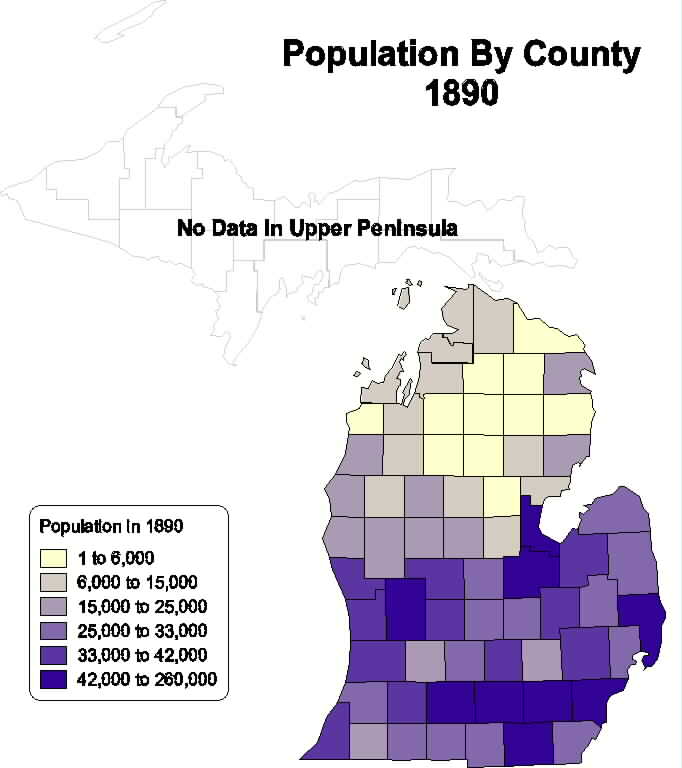
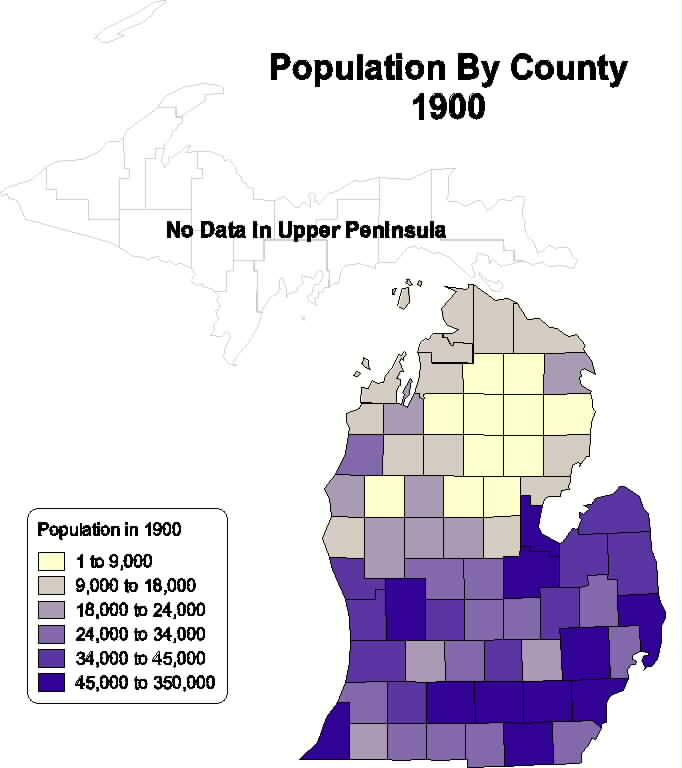
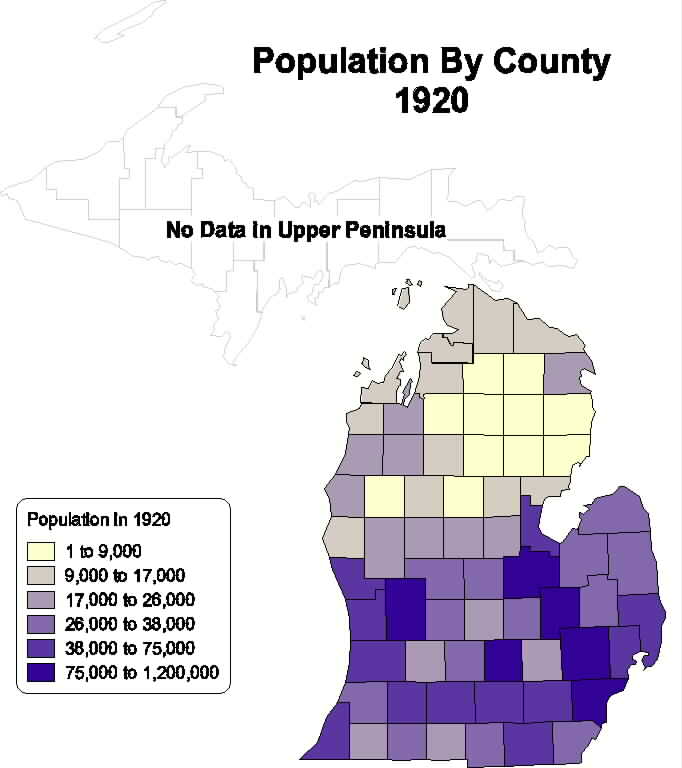
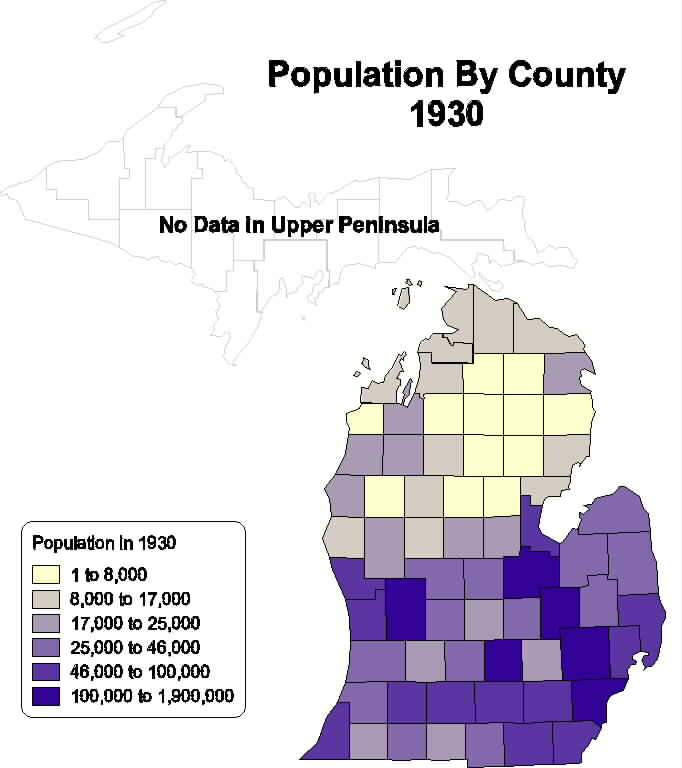
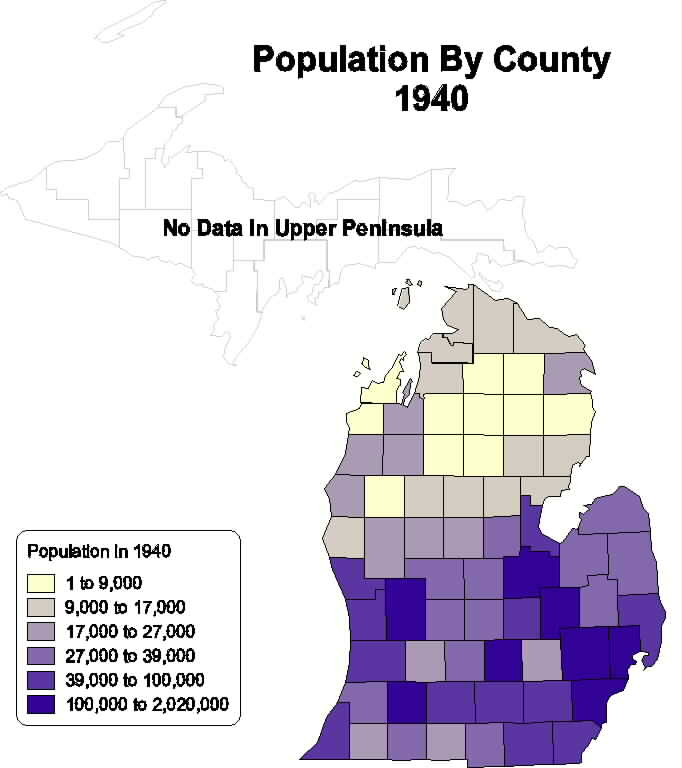
PLEASE NOTE that the legend changes for each map--that is, a color scheme on one
map may not imply the same number of people in that county, as it would on a later map.
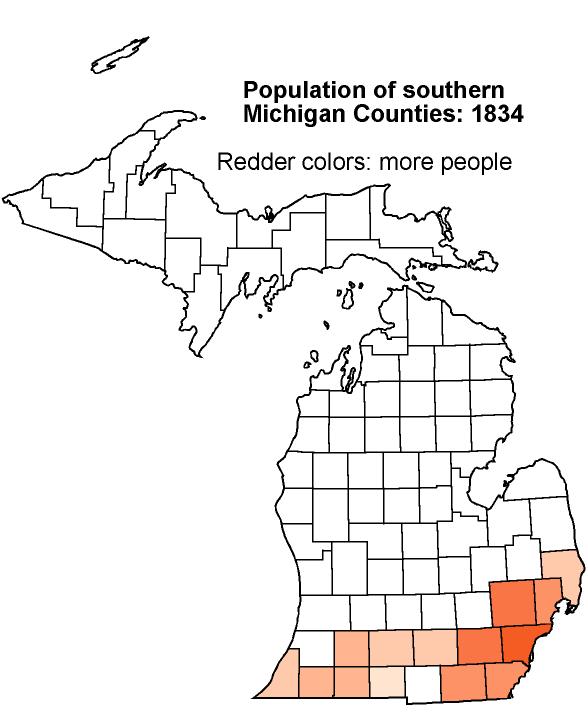
Source: Michigan State University, Department of Geography
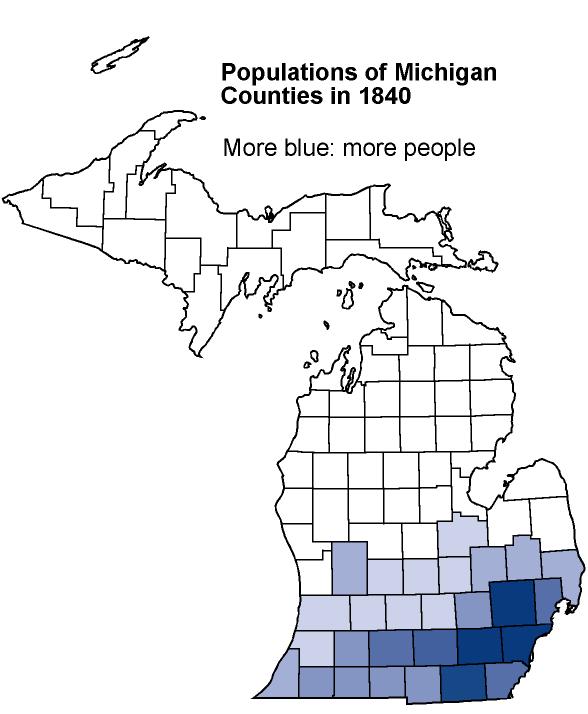
Source: Michigan State University, Department of Geography
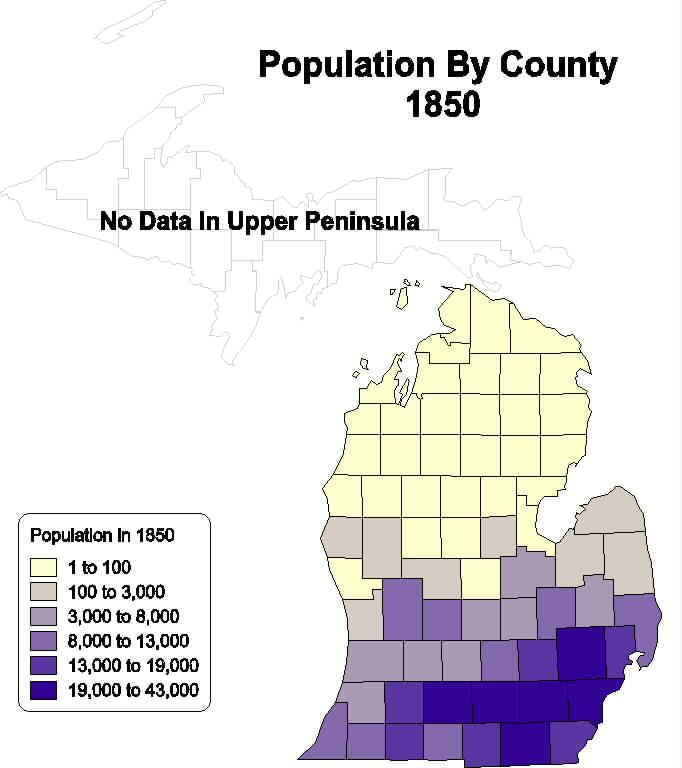
Source: Michigan State University, Department of Geography
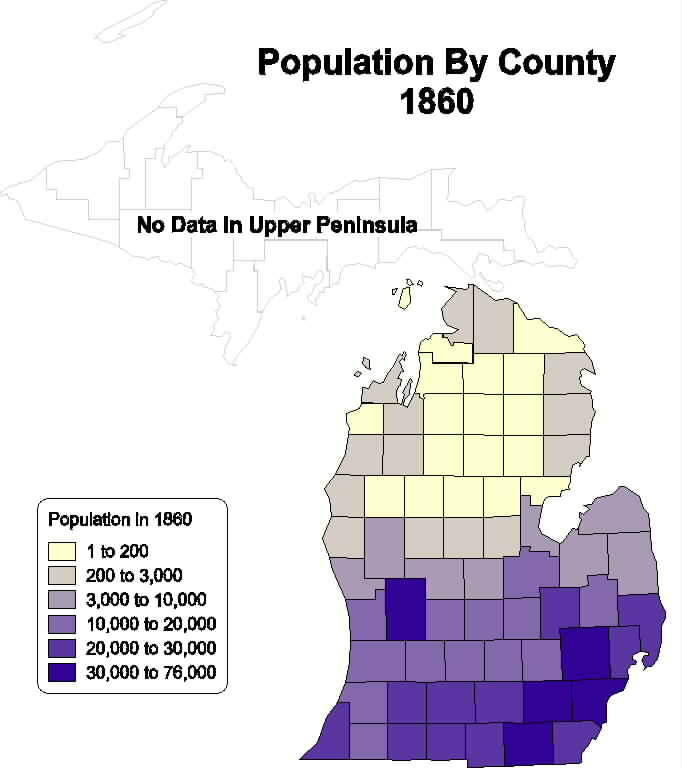
Source: Michigan State University, Department of Geography
Source: Michigan State University, Department of Geography
Source: Michigan State University, Department of Geography
Source: Michigan State University, Department of Geography
Source: Michigan State University, Department of Geography
Source: Michigan State University, Department of Geography
Source: Michigan State University, Department of Geography
Source: Michigan State University, Department of Geography
Source: Michigan State University, Department of Geography
This material has been compiled for educational use only, and may not be reproduced without permission. One copy may be printed for personal use. Please contact Randall Schaetzl (soils@msu.edu) for more information or permissions.