MIGRATION
Migration of people into and out of Michigan (as well as intra-state movements) has long
been of interest to Geographers. Drs. Groop and Manson of MSU's Geography Department
have been studying migration for a number of years. The maps below were taken from
some of their work, and show inter-state flows of people during the years 1976 through
1988.
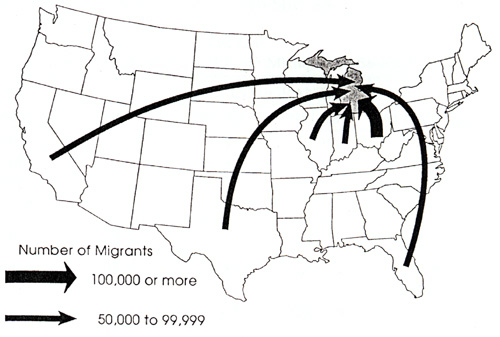
Below, notice that the states which send the most immigrants to Michigan are Ohio,
Florida, Indiana, Illinois, Texas, and California.
Meanwhile, out-migration from the state often results in U-Haul trucks and trailers being
transported to: Florida, Texas, California, Arizona, Ohio, Indiana, and Illinois.
The first four states mentioned above probably get most of their Michiganders due
to elderly persons moving to those states and retiring there.
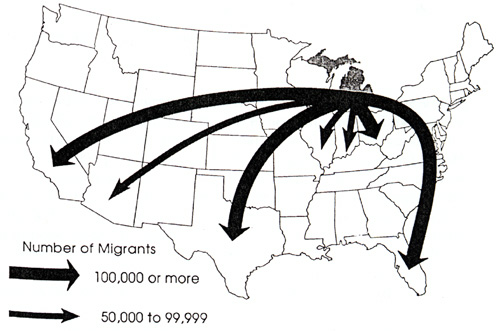
You probably surmised from the two maps above that Florida, California, Ohio, and some
other states not only "get" lots of people from Michigan, but are also popular
destinations for emmigrants from our state. So what is the final tally...who's
gaining and who's losing people?
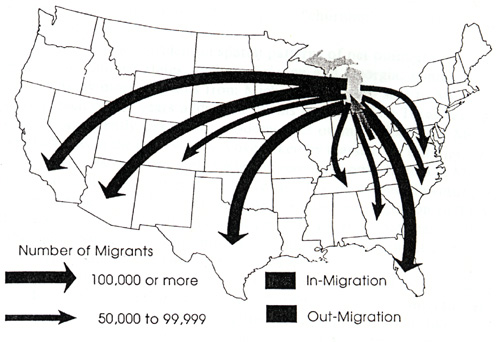
As a way of answering that questions, the map below shows net in- and
out-migration totals. Note that many more people are leaving Michigan than are
migrating here to stay. This is probably because during the 80's (when these data
were tallied) Michigan's economy was not strong, and people were moving to the Sun Belt to
get jobs or to retire. Today, these trends are slowing or even reversing.
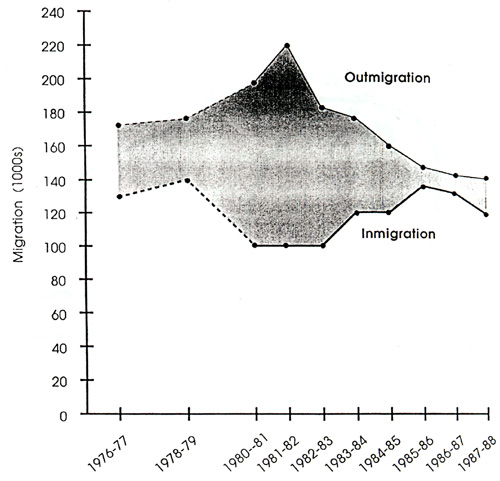
Note (below) how the gap between losses and gains was narrowing in the late 1980's.
Note also how, during the hard economic times of the early 80's, many people were
leaving the state for "greener pastures". Out-migration
from 1970-90 totaled nearly a million people, or 10% of the 1970 population. Why? 1980's
recession and loss of jobs.
Internal migrations (within the state) have been less studied. During the late
1800s, European immigrants began pouring into Michigan, mixing their cultural traditions
with those of the state’s previous settlers. Although most immigrants were
subsistence farmers, some were highly skilled; and the efforts of these people helped to
diversify the crop base of the state. The Germans settled
predominantly in southeastern Michigan and in Saginaw and Berrien Counties, areas that
proved to have excellent farmland and even today are top agricultural producers. The Danes
were another group of skilled farmers, and they specialized in growing potatoes in the
area northeast of Muskegon. The Dutch arrived in 1846 and
introduced the raising of celery; even today, the area around Grand Rapids remains a Dutch
stronghold, and celery and other truck crops are still grown there. Some groups, such as
the Finns, were brought to Michigan in the 1870s to work in
mines of the Upper Peninsula; their real interest, however, lay in farming, and settling
on the eastern edge of the mining district, they worked long and hard to raise money to
buy farms.
Many of these migration events have been triggered by economic boom (or
bust) events, like the logging boom or the bust of the Great Depression. For
example, migration of unemployed industrial workers to Kalkaska Country during the Great
Depression raised the county’s population and stimulated its agricultural growth.
Kalkaska also benefited from the Civilian Conservation Crops, which planted seedlings all
across its barren cutover wastelands. But migration to the armed forces and industrial
centers during World War II reduced the county’s population to less than 3,600.
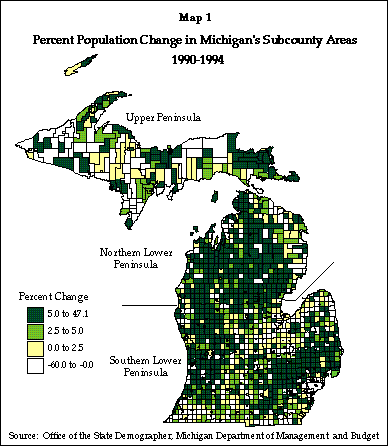
Maps that show changes (looses or gains) in an area, are useful in understanding internal
migrations, as well as demographics like older areas that have fewer births, and
"yuppie" areas with lots of children. The map below illustrates some of
these points. Note the loss of population for many areas in the UP--where job growth
is slow and populations are older.
This material has been compiled for educational use only, and
may not be reproduced without permission. One copy may be printed for personal
use. Please contact Randall Schaetzl (soils@msu.edu)
for more information or permissions.


