Completed Maps, Figures, and Graphics
|
|||||||||||||||||||||||||||||||||||||||||||||||||||||||||||||||||||||||||||||||||||||||||||||||||||||||||||||||||||||||||||||||||||||||||||||||||||||||||||||||||||||||||||||||||||||||||||||||||||||||||||||||||||||||||||||||||||||||||||||||||||||||||||||||||||||||||||||||||||||||||
Holocene Forest Vegetation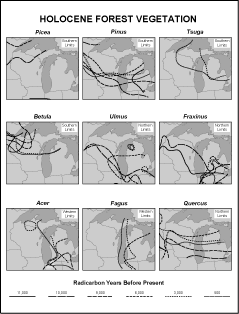 |
Cowden Lake Pollen Diagram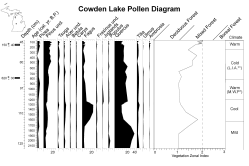 |
Kitchner Lake Pollen Diagram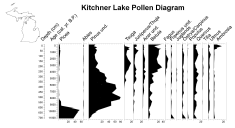 |
Wintergreen Lake Pollen Diagram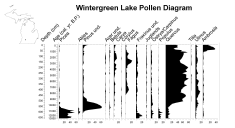 |
| Top | ||
Ch. 8 Pleistocene fauna Al Holman
Mastodon and Mammoth Sites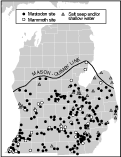 |
Giant Beavers |
Mastodon and Mammoth |
Musk Oxen |
Peccaries |
Stag Moose |
|
| Top | |||
Ch. 9 Michigan seismicity Kaz Fujita / Norman Sleep
Types of Seismic Waves 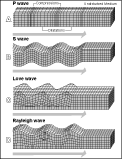 |
Seismicity Map of Michigan 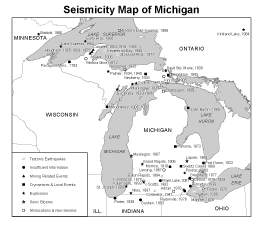 |
Felt Intensities for the 1947 Coldwater event 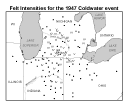 |
Isoseismals for the 1994 Eaton Rapids event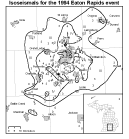 |
Glacial Unloading Effects  |
Faults and Gravity Highs in southern Michigan and Adjacent Indiana and Ohio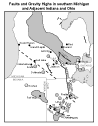 |
Out-of-State earthquakes felt in Michigan  |
| Top | |||
Ch. 14 The Great Lakes Ted Batterson
Great Lakes System Profile 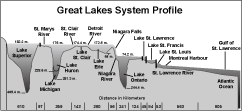 |
Lake Hydrology: Short-term Fluctuations 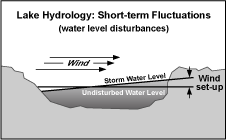 |
Great Lakes Hydrologic System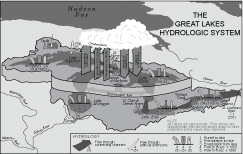 |
Chicago Rivers and Canals 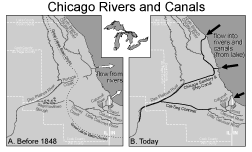 |
Seasonal Fluctuations  |
Long Term Fluctuations 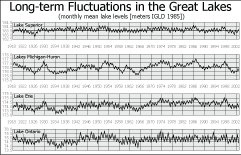 |
Invasive Species in the Great Lakes 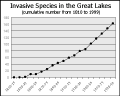 |
Timeline of Entry Mechanisms for
Aquatic Species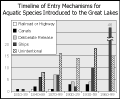 |
Counties of the Great Lakes Basin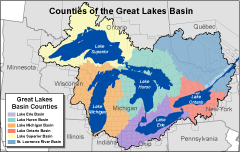 |
Great Lakes Ownership 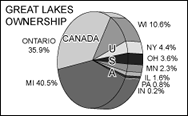 |
||
| Top | ||
Ch. 15 Surface water resources Lois Wolfson
Augusta Creek  |
Sphagnum peat-dominated bog |
Upper Tahquamenon Falls  |
AuSable River  |
Lime Lake  |
Yellow water lily & water shield plants |
Red Cedar River |
|
| Top | |||
Ch. 18 Dunes and eolian landforms Alan Arbogast
Perched Dune Model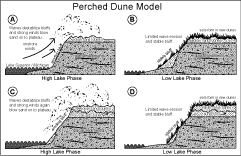 |
|||
| Typical Foredune Fig. 2  |
Fig. 4  |
Grand Sable Dunes Fig. 5b  |
Typical low-perched Dunes Fig. 7  |
| Blowout looking west Fig. 8b  |
Buried soil in coastal dune Fig. 9a  |
Weakly develop soil in coastal dune Fig. 9b |
Well developed soil in coastal dune Fig. 9c |
| Van Buren exposure Fig. 10  |
Foundry Sand Mold Fig. 11  |
Dune development Fig. 12  |
U.P. interior dune Fig. 13  |
| Top | |||
Ch. 19 Meteorology, storms and hazards Jeff Andresen / Julie Winkler
Michigan 30-Year Climate Normals 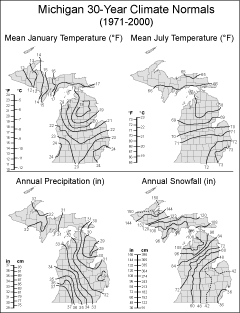 |
|
Major Cyclogenic Areas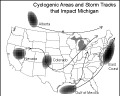 |
Climatology of Airflow Trajectories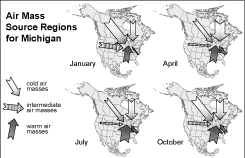 |
| Top | |
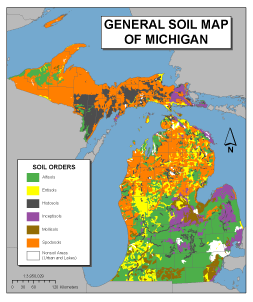
Ch. 20 Soils Randy Schaetzl
General Soils Map of Michigan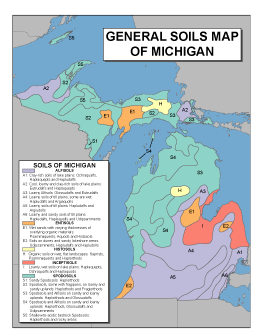 |
Dominant Drainage Class of Soils in Michigan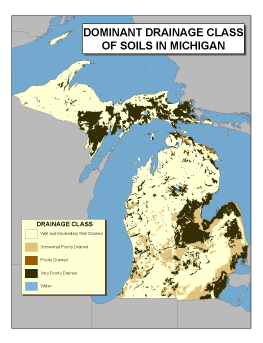 |
Dominant Surface Texture of Soils in Michigan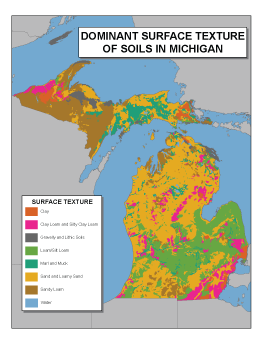 |
| Kalkaska sand state soil  |
Typic udipsamment Fig 3  |
Chippewa clay plains Fig 4  |
Histosols Fig 5  |
| Dark surface Mollisols Fig 6  |
Alfisol in ditch Fig 7  |
Celery on muck Fig 12  |
|
| Top | |||
Ch. 21 Plant geography Jay Harman
Location of Floristic Tension Zone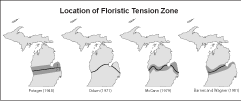 |
Species Range Limits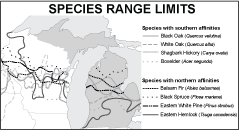 |
Figure 1 |
Figure 2 |
Figure 5 |
Figure 6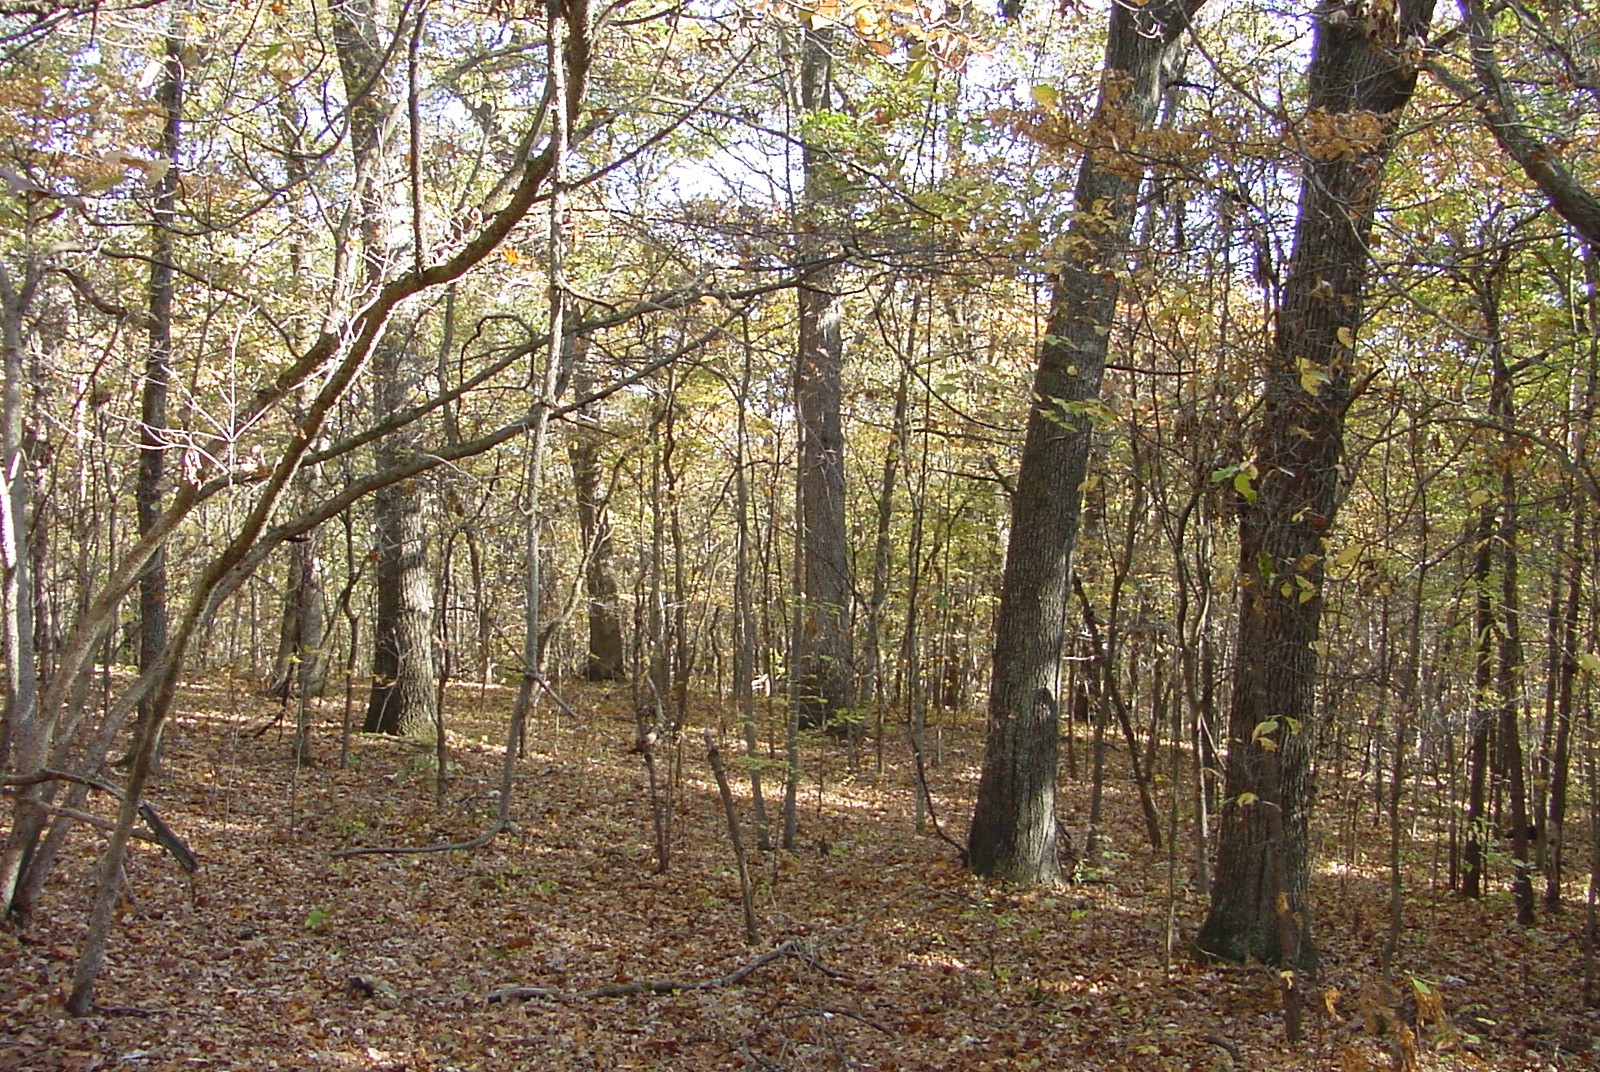 |
Figure 8 |
Figure 9 |
Figure 10 |
Figure 11 |
Figure 14 |
Figure 15 |
Middleville prairie |
|
| Top | |||
Ch. 24 Between the Glaciers and Europeans: The People of Michigan from 12 000 to 400 Years Ago Bill Lovis
Michigan Prehistory |
|
| Top | |
Ch. 26 Native Americans in Michigan George Cornell
Michigan Casinos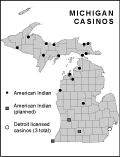 |
Indian Land Cessions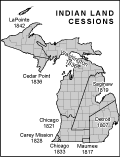 |
Indian Tribes 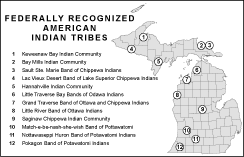 |
| Top | ||
Ch. 27 The US Public Land Survey in Michigan Morris Thomas
Township and Range System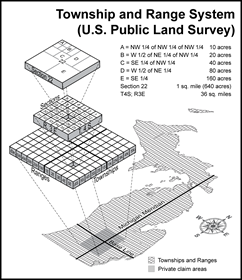 |
Township and Range Map 1  |
Township and Range Map 2 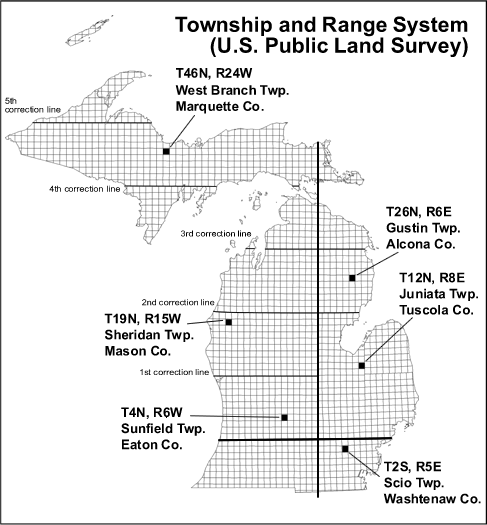 |
|
Original Military Districts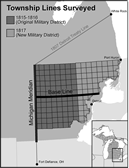 |
Townships Re-surveyed 1845-1856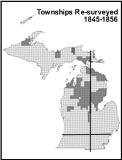 |
| Top | |
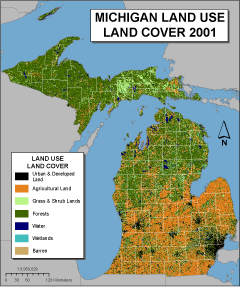
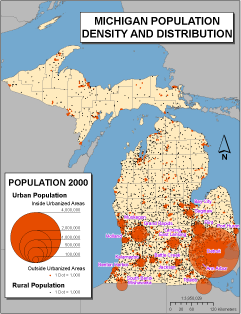
Ch. 29 Land use and land cover patterns Bill Welsh / Daniel Brown / Joe Messina
LULC Northwest Lower Peninsula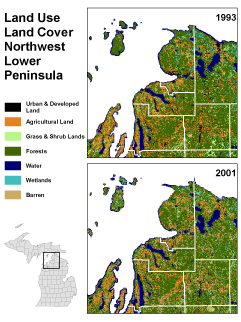 |
LULC Detroit |
|
| Top | ||
Ch. 30 The auto industry and the manufacturing sector A.J. Jacobs
Manufacturing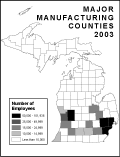 |
|
| Top | |
Ch. 32 Race issues and Detroit Joe Darden
Municipalities in Metro Detroit |
Detroit Percent Black 1970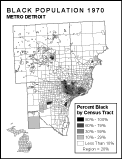 |
Detroit Percent Black 1980 |
Detroit Percent Black 1990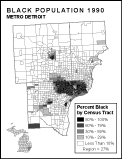 |
Detroit Percent Black 2000 |
Detroit Percent Asian 2000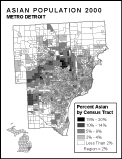 |
Detroit Percent Hispanic 2000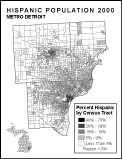 |
Detroit Percent Mixed 2000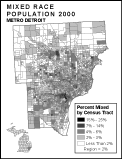 |
Detroit Percent Native American 2000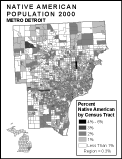 |
Detroit Percent White 2000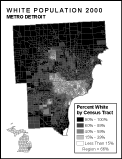 |
Detroit Concentrated Affluence 1999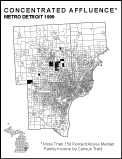 |
Detroit Concentrated Poverty 1999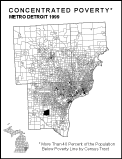 |
|
Trends in Detroit Segregation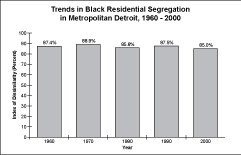 |
Residential Segregation in Detroit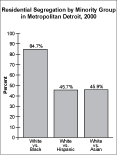 |
|
| Top | ||
Ch. 36 Agriculture: field crops Don Christenson / Darryl Warncke
Hectares of Corn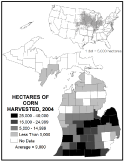 |
Hectares of Dry Edible Bean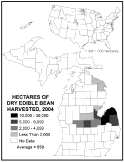 |
Hectares of Potato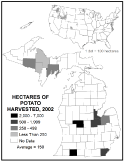 |
Hectares of Soybean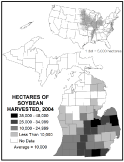 |
Hectares of Sugarbeet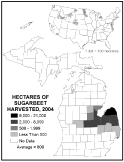 |
Hectares of Wheat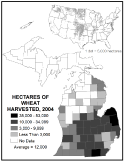 |
Trends in Crop Production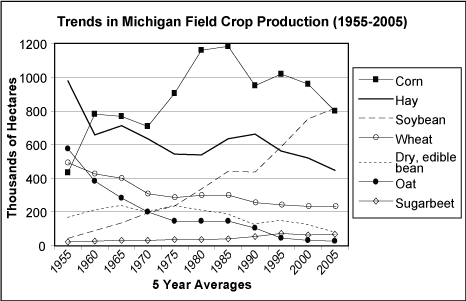 |
Beets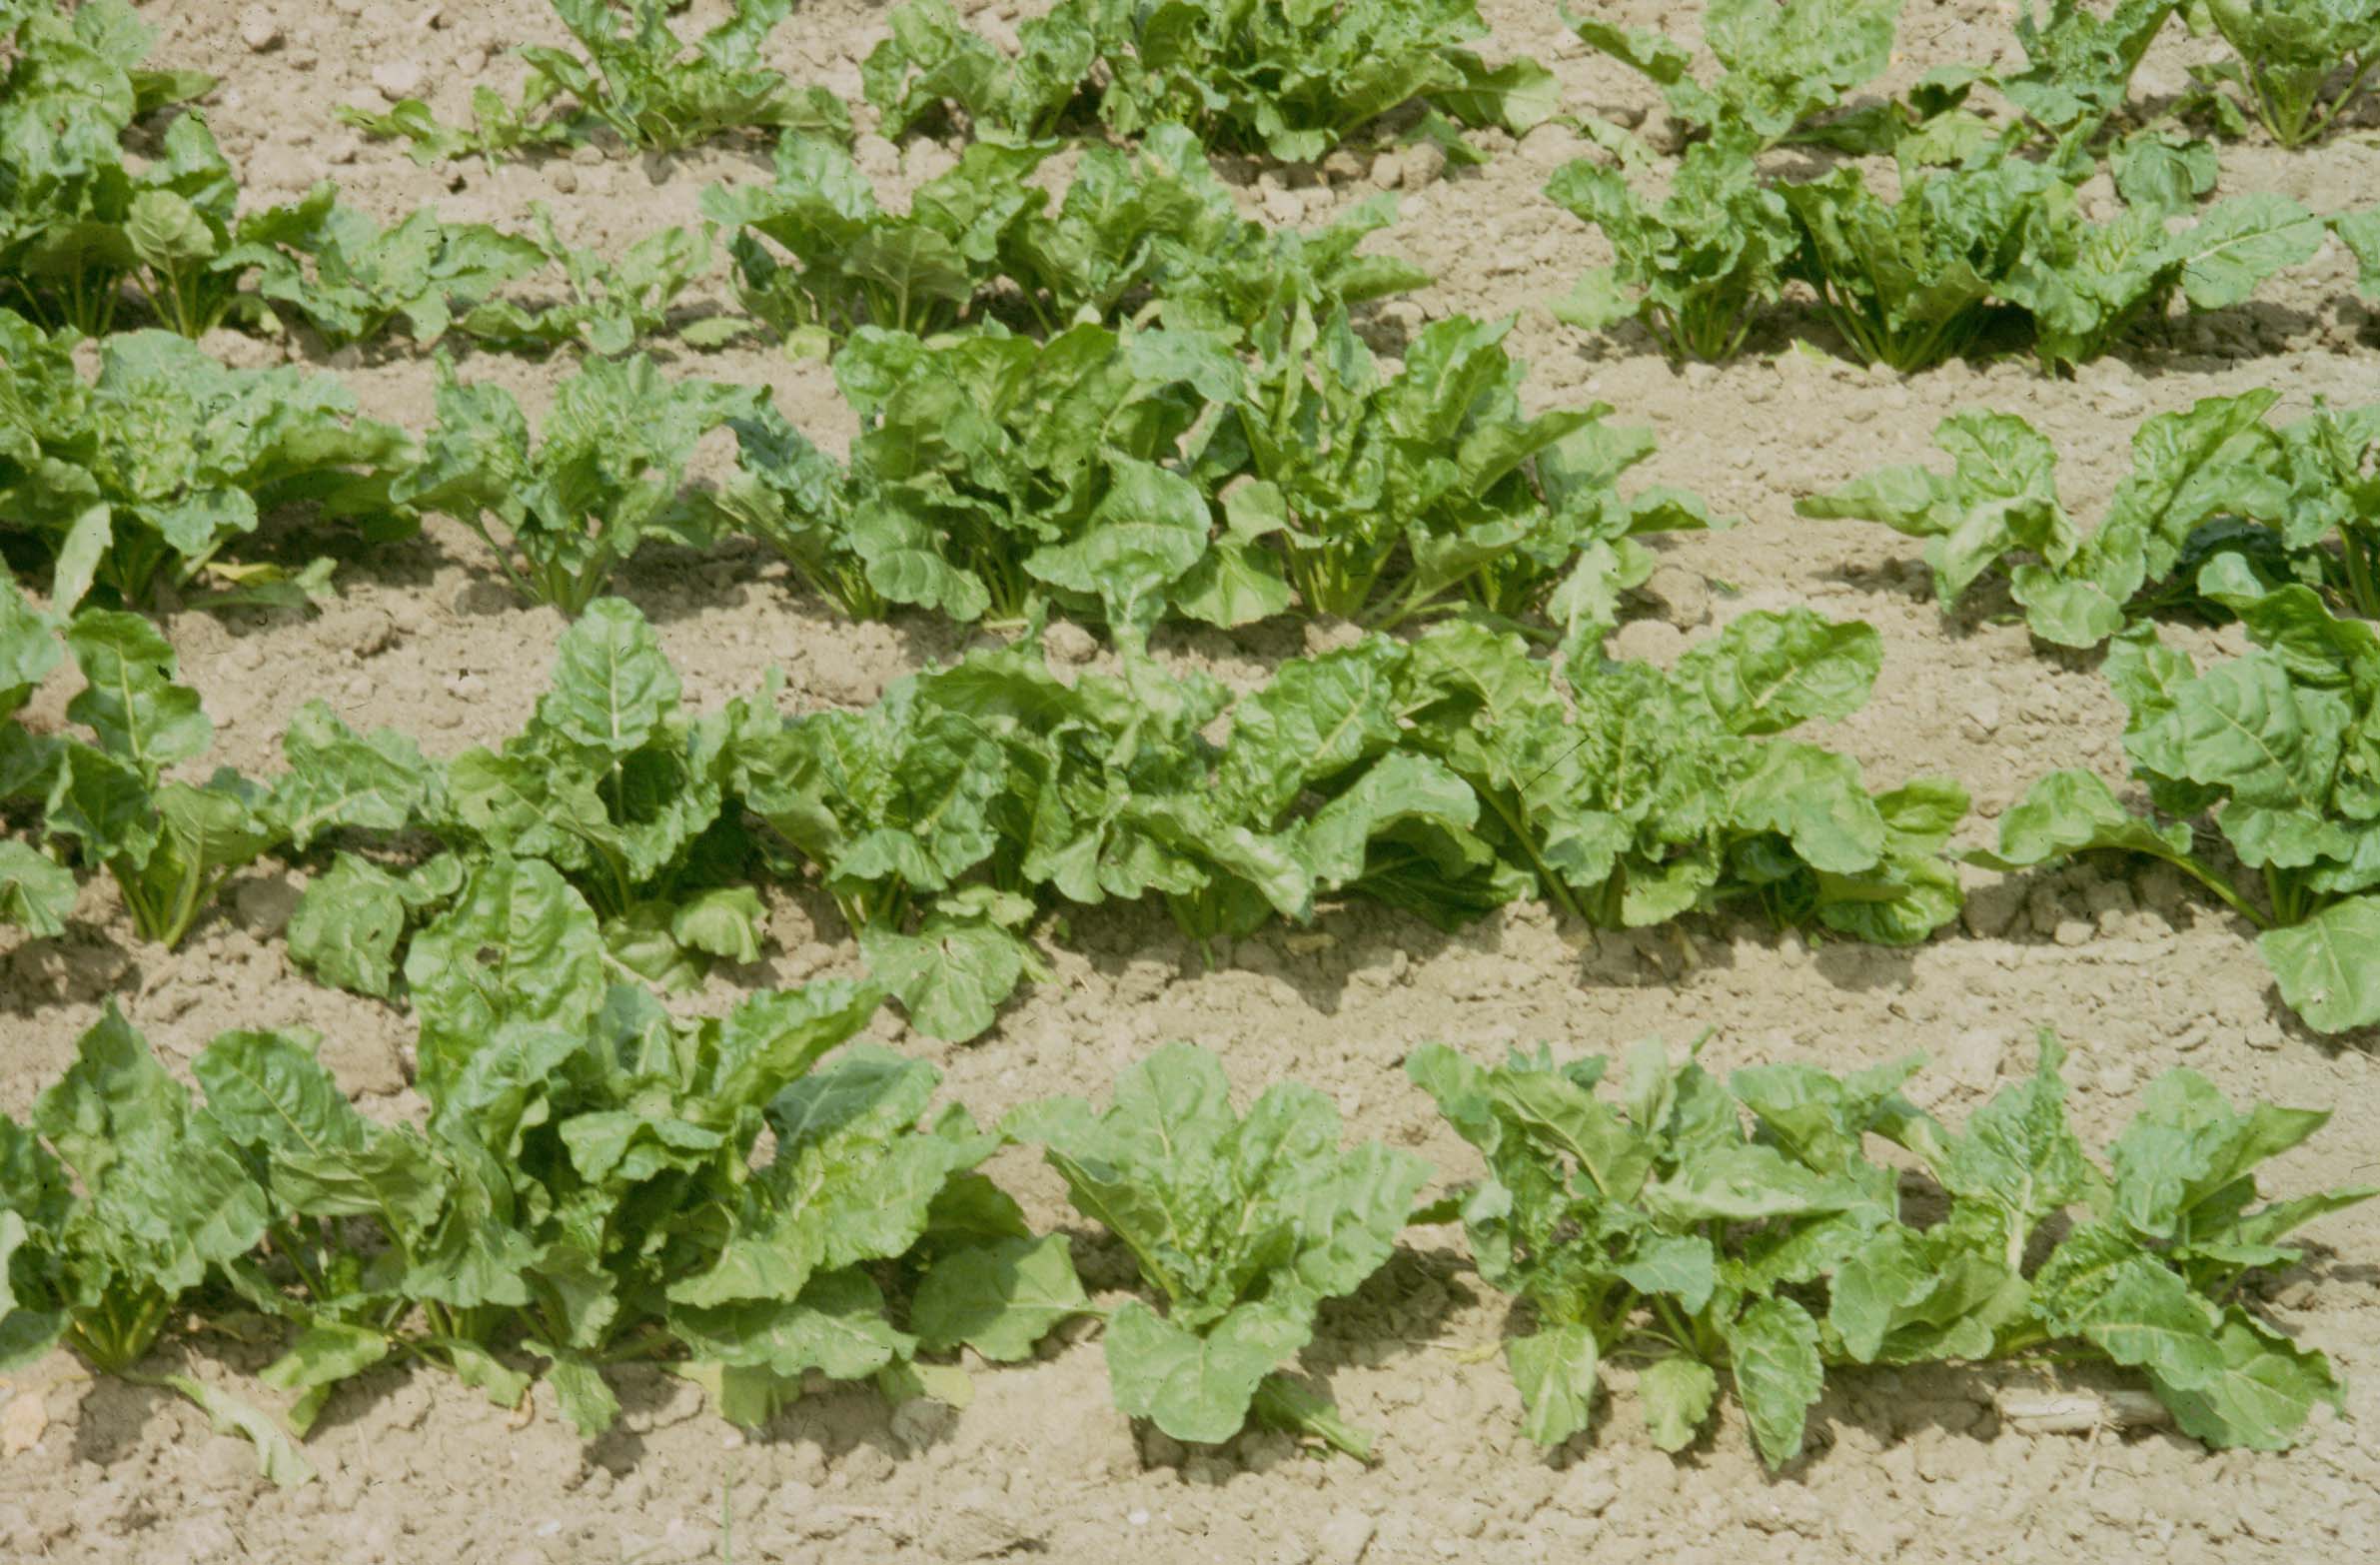 |
Unloading beet truck |
Oats |
Heavy soil on lake plain |
Hay in rows |
| Top | ||
Ch. 37 Agriculture: speciality crops Darryl Warncke / Don Christenson
Major Michigan Sod Farms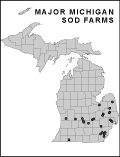 |
Agricultural Statistics Districts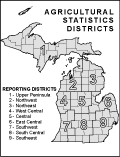 |
Top Vegetable Producers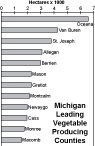 |
Vegetable Production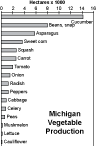 |
Vegetable Fresh Market Production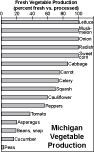 |
Celery |
Onions |
Radish |
Sod |
| Top | ||
Ch. 39Agriculture: grapes and wine Tom Zabadal
Vineyards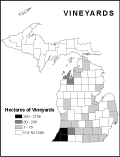 |
Wineries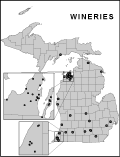 |
Effects of Topography on Minimum Air Temperatures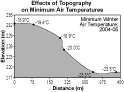 |
| Top | ||
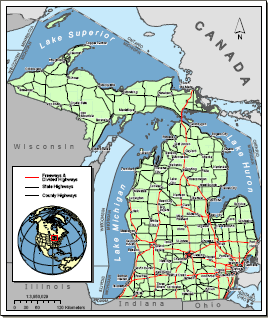
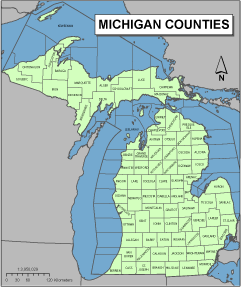
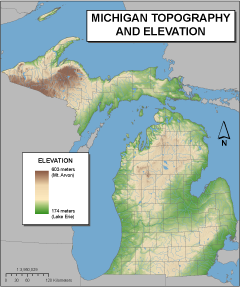
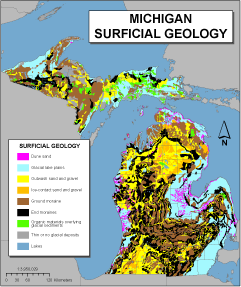
Appendix Communal maps (color plates, most will span two pages)
|
|
|
|
|
|
|
|
|
|
|
 Low Resolution or High Resolution |
 Low Resolution or High Resolution |
|
| Top |