ICE COVER on the Great Lakes
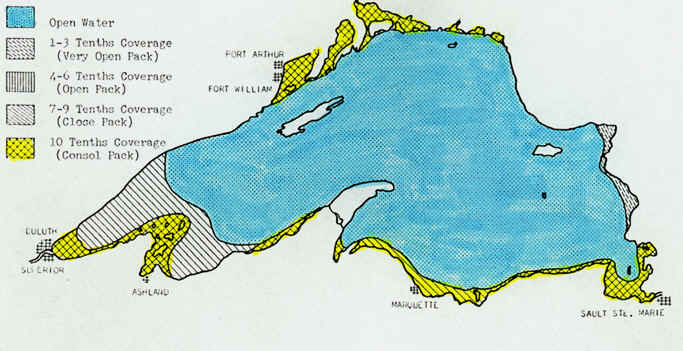
The map below shows the typical distribution of ice on Lake Superior for early January. Note that only the more sheltered areas actually achieve complete "iced-over" conditions, and that most of the open water is ice-free. Floating ice masses are, however, fairly common on the open lake.
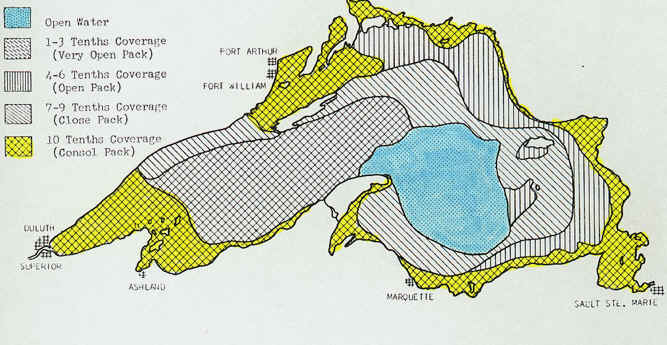
By mid-February, the lakes are at their coldest, and ice is the most widespread, as
indicated on the map below.
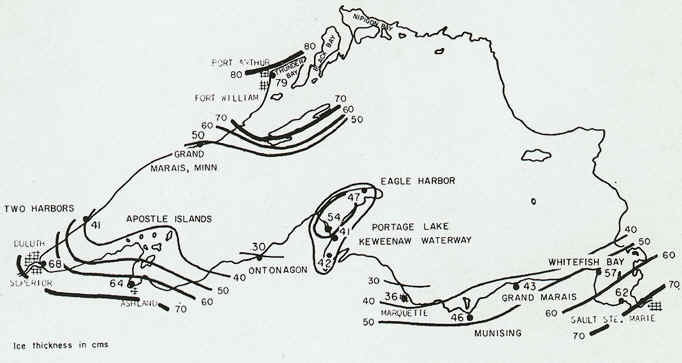
The map below shows the expected maximum thickness of ice on Lake Superior. Rarely does pack ice form to depths greater than 60 cm.
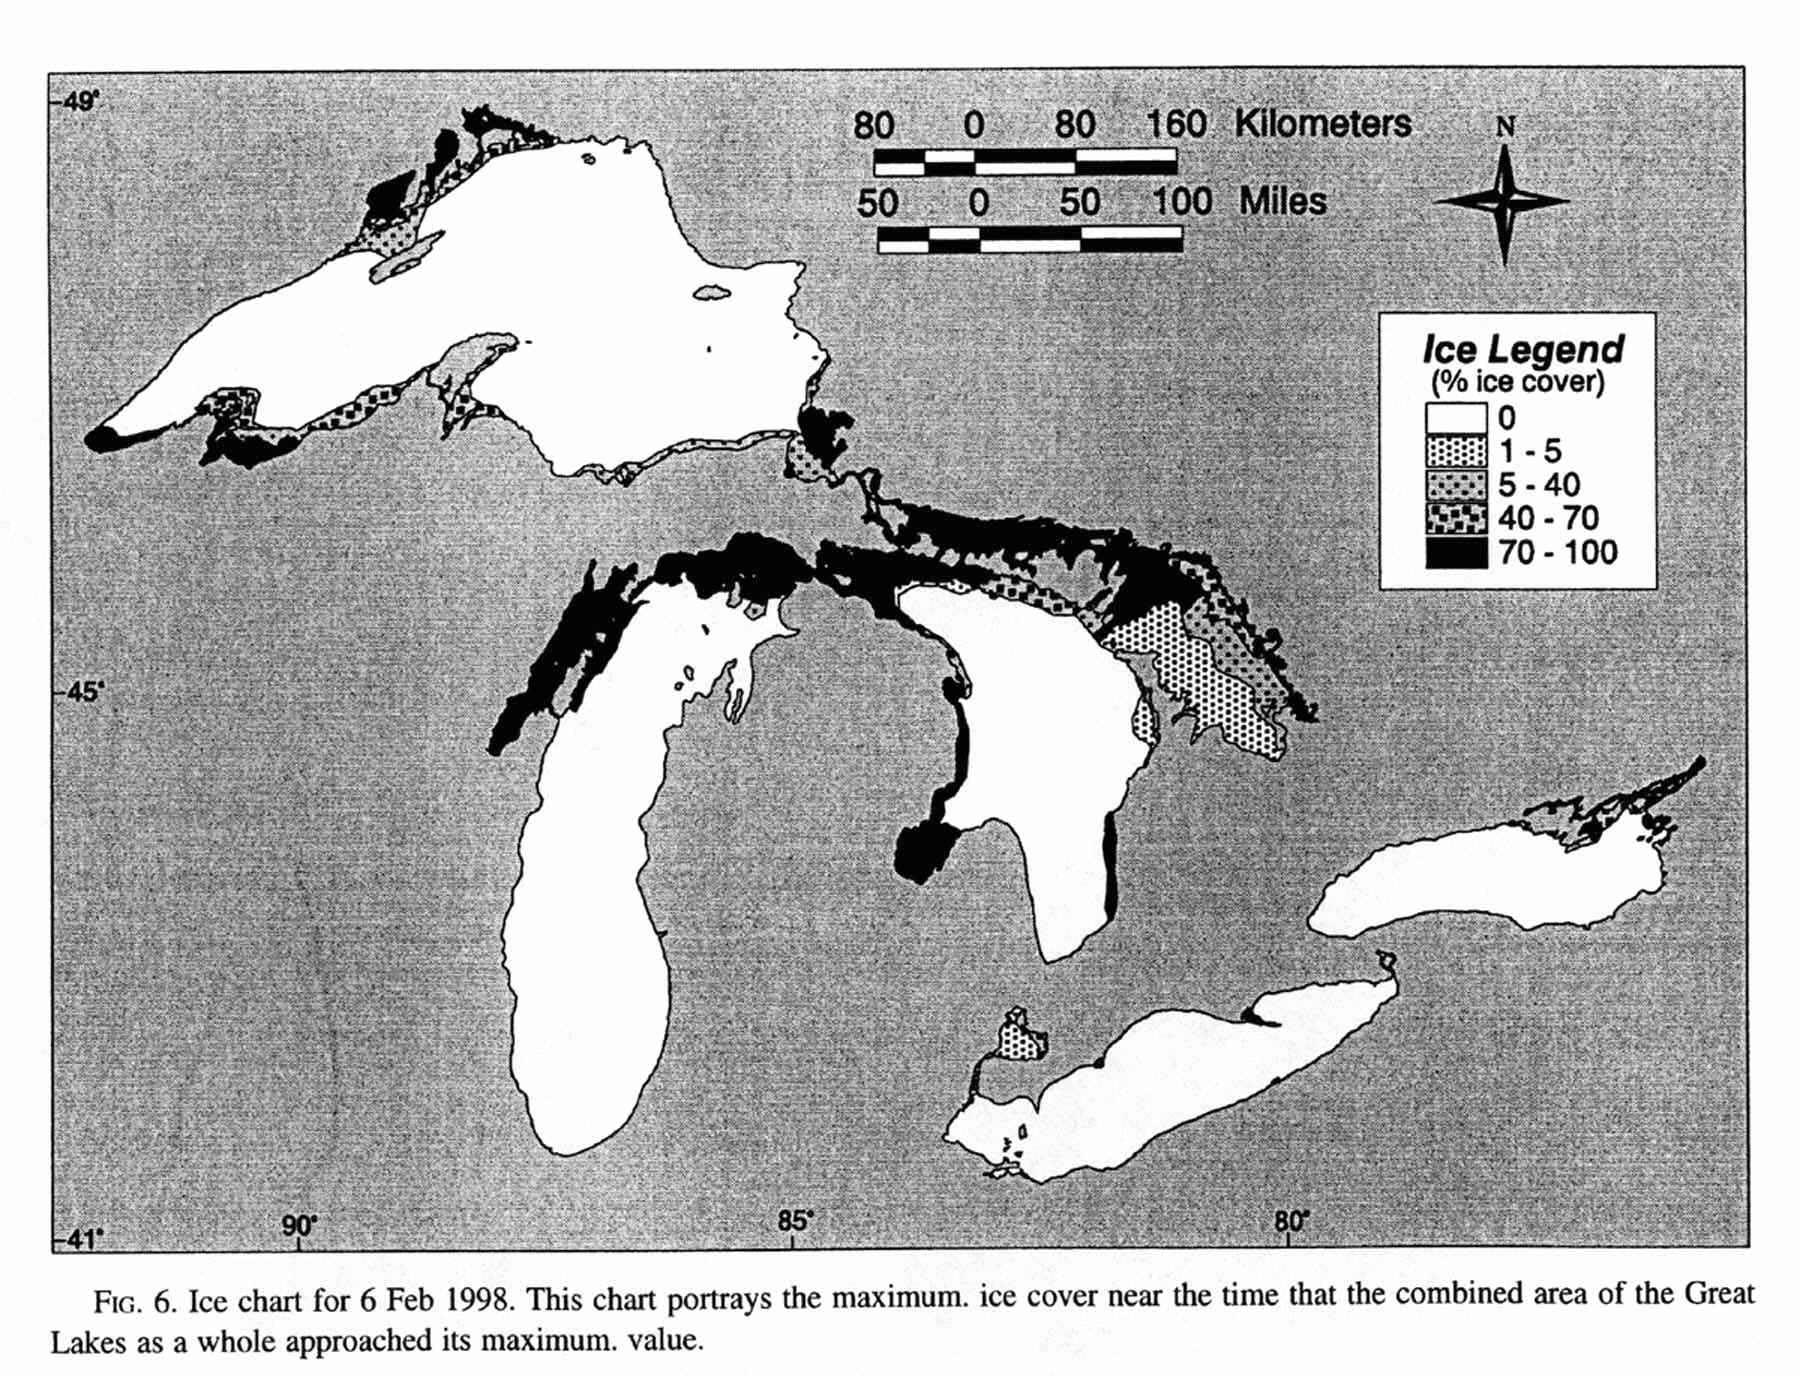
The winter of 1997-98 was one of the warmest and driest on record in the Great Lakes
region, due in large part to a strong El Nino event in the southern Pacific Ocean.
As a result, the Great Lakes experineced one of the least extensive
ice covers of the 20th century. Maximum ice cover data set new low
records for Lakes Erie (only 5% ice covered, at maximum), Ontario (6%), Superior (11%),
and Huron (29%). The map below shows what the ice cover on the Great Lakes looked
like in February of that winter--rarely will you see so little ice cover on the Great
Lakes at this time of winter!
Click here for full size image (381 kb)
This material has been compiled for educational use only, and may
not be reproduced without permission. One copy may be printed for personal
use. Please contact Randall Schaetzl (soils@msu.edu)
for more information or permissions.